搭建开源地图服务(三)-使用OpenLayers呈现地图

按之前的设想,现在应该用MapProxy或TileStache来搭建WMS服务了,但TileMill本身就提供了一个看起来还不错的地图瓦片服务(XYZ模式的),而且OpenLayers本身也支持这种模式,于是打算直接用OpenLayers访问TileMill的瓦片服务接口,先看看效果再说。
OpenLayers是一个开源的为WEB GIS客户端提供的JS库,可以方便的对地图做各种处理。目前已发布3.0版本了,官网:http://openlayers.org/, 上面的文档也算丰富,其中还包含了各种Example, 对初学者帮助很大!另外再推荐一下 Leaflet 相对来说算是轻量级的,但也非常的好用!
1. 简单的地图呈现
本次,我们只是简单的展现一下地图,通过官方的Example稍作修改,代码很简单,示例如下:
其中,ol.source.XYZ.url 中的IP请替换成你自己的即可。 ol.View.center/zoom 指定地图的中心点以及默认缩放级别,我们把焦点移到之前的台湾宝岛上看看!
<!doctype html>
  <html lang="en">
    <link rel="stylesheet" href="http://openlayers.org/en/v3.0.0/css/ol.css" type="text/css">
    <style> .map { height: 600px; width: 100%; } </style>
    <script src="http://openlayers.org/en/v3.0.0/build/ol.js" type="text/javascript"></script>
    <title>OpenLayers 3 example</title>
    <h2>My Map</h2>
      <div id="map" class="map"></div>
      <script type="text/javascript">
        var map = new ol.Map({
          target: 'map',
          layers: [ new ol.layer.Tile({ source: new ol.source.XYZ({ url: 'http://xxx.xxx.xxx.xxx:20008/tile/OSMBright/{z}/{x}/{y}.png' }) }) ],
          view: new ol.View({ center: ol.proj.transform([121.11, 23.82], 'EPSG:4326', 'EPSG:3857'), zoom: 8 })
        });
      </script>
如果没有问题的话,访问该html变可看到自己的地图了:-)
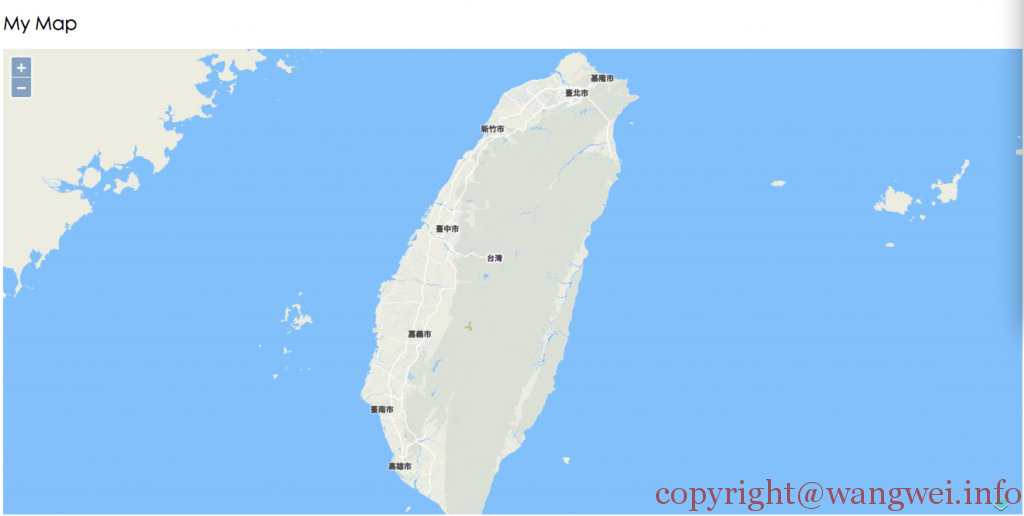
OpenLayers台湾地图示例
2. 通过GeoJson实现地图矢量要素层
有了地图的底图,我们还需要在此之上呈现一些交互,例如POI打点,绘制线,多边形等相关的应用,甚至是动态数据的呈现。
GeoJson是基于Json的数据格式为基础,专门为地理数据编码的一种载体,其中支持的几何类型有:点、线、面、多点、多线、多面以及几何数据的集合。GeoJson里包含了这些几何对象基本的特征属性。以下代码是参考 http://openlayers.org/en/v3.0.0/examples/geojson.html 的例子生成的,简单的实现了GeoJson作为载体的地图向量数据呈现的一个测试:
<!doctype html>
<html lang="en">
<link rel="stylesheet" href="http://openlayers.org/en/v3.0.0/css/ol.css" type="text/css">
<style>
    .map {
        height: 600px;
        width: 100%;
    }
</style>
<script src="http://openlayers.org/en/v3.0.0/build/ol.js" type="text/javascript"></script>
<title>OpenLayers 3 example</title>
<h2>My Map</h2>
<div id="map" class="map"></div>
<script type="text/javascript">
    var image = new ol.style.Circle({
        radius: 5,
        fill: new ol.style.Stroke({
            color: 'red'
        }),
        stroke: new ol.style.Stroke({
            color: 'red',
            width: 1
        })
    });
    var styles = {
        'Point': [new ol.style.Style({
            image: image
        })],
        'LineString': [new ol.style.Style({
            stroke: new ol.style.Stroke({
                color: 'green',
                width: 1
            })
        })],
        'Polygon': [new ol.style.Style({
            stroke: new ol.style.Stroke({
                color: 'blue',
                lineDash: [4],
                width: 3
            }),
            fill: new ol.style.Fill({
                color: 'rgba(0, 0, 255, 0.1)'
            })
        })],
        'Circle': [new ol.style.Style({
            stroke: new ol.style.Stroke({
                color: 'red',
                width: 2
            }),
            fill: new ol.style.Fill({
                color: 'rgba(255,0,0,0.2)'
            })
        })]
    };
    var vectorSource = new ol.source.GeoJSON( /** @type {olx.source.GeoJSONOptions} */ ({
        object: {
            'type': 'FeatureCollection',
            'crs': {
                'type': 'name',
                'properties': {
                    'name': 'EPSG:3857'
                }
            },
            'features': [{
                'type': 'Feature',
                'geometry': {
                    'type': 'Point',
                    'coordinates': ol.proj.transform([121.11, 23.82], 'EPSG:4326', 'EPSG:3857')
                }
            }, {
                'type': 'Feature',
                'geometry': {
                    'type': 'LineString',
                    'coordinates': [
                        [3e1, 1e5],
                        [4e6, 3e1]
                    ]
                }
            }, {
                'type': 'Feature',
                'geometry': {
                    'type': 'Polygon',
                    'coordinates': [
                        [
                            [-5e6, 2e1],
                            [-4e6, 1e6],
                            [-3e6, -1e6]
                        ]
                    ]
                }
            }, ]
        }
    }));
    var styleFunction = function(feature, resolution) {
        return styles[feature.getGeometry().getType()];
    };
    var vectorLayer = new ol.layer.Vector({
        source: vectorSource,
        style: styleFunction
    });
    var map = new ol.Map({
        target: 'map',
        layers: [new ol.layer.Tile({
            source: new ol.source.XYZ({
                url: 'http://xxx.xxx.xxx.xxx:20008/tile/OSMBright/{z}/{x}/{y}.png'
            }),
        }), vectorLayer],
        view: new ol.View({
            center: ol.proj.transform([121.11, 23.82], 'EPSG:4326', 'EPSG:3857'),
            zoom: 2
        })
    });
</script>
效果应该是这样的:
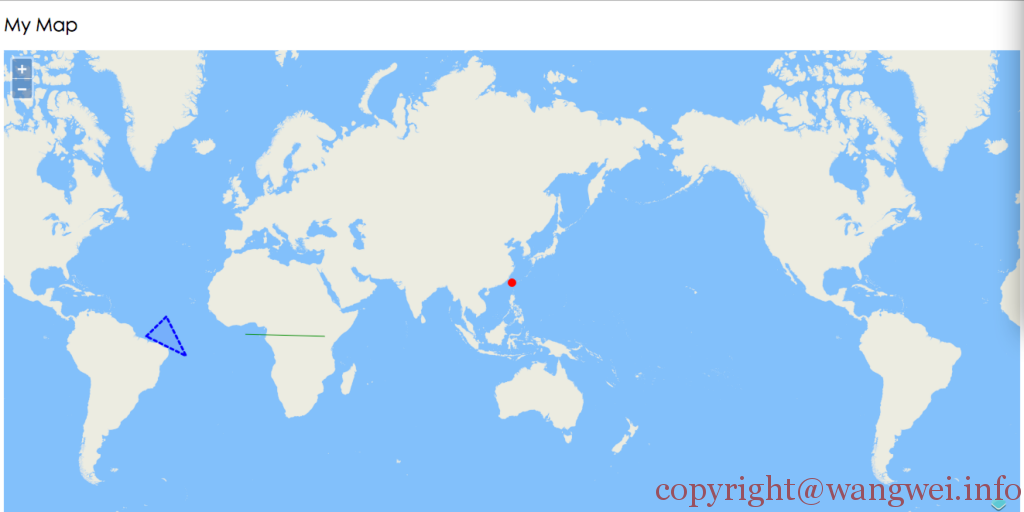 OpenLayers GeoJson Example
到此为止,我们已经可以通过OpenLayers作一些简单的WebGIS应用了,搭建开源地图服务的话题暂且告一段落。当然我们还缺失一些关键性的服务器,例如地图瓦片的缓存,以及一些接口的标准化的处理,包括之前预想使用的MapProxy和TileStache,或许本次的主题称之为借助TileMill实现地图服务更合适,呵呵。以上内容仅仅是记录了我个人对地图服务搭建学习过程中的一些点滴。随着以后不断深入学习,我尽量逐步完善和公布一些我对开源地图服务细节上的认知。